How to Read Exam Output
Mis-Keyed Items
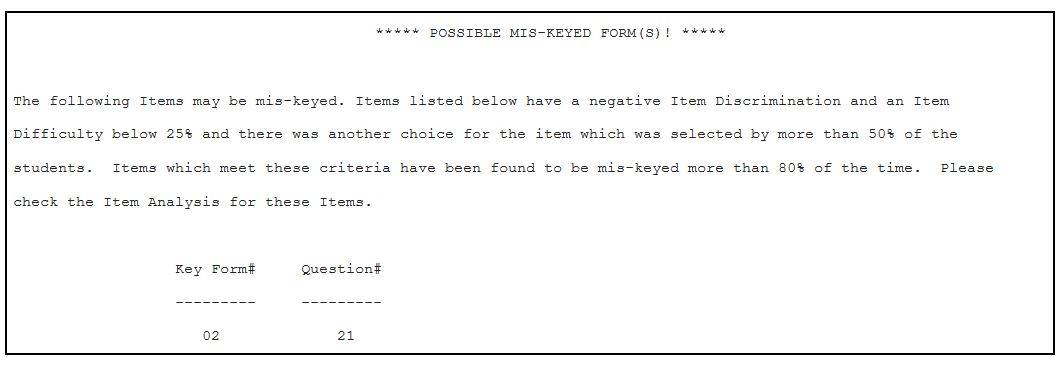
The preface page of the faculty exam output may contain a list of possible mis-keyed items (i.e., items may be incorrectly bubbled on the key sheet) and their associated form (if applicable). In the example, item 21 on form 2 is flagged as a possible mis-keyed item. The faculty member should review the item analysis (discussed later) to determine if the wrong response choice has been bubbled. If the response choice should be changed, the faculty member needs to call TEMC to request that the keyed answer be changed and the exam output reprocessed (TEMC will edit the data in the scan file, but will not alter any marks on the hard copy of the key sheet).
Students Scored with Wrong Key
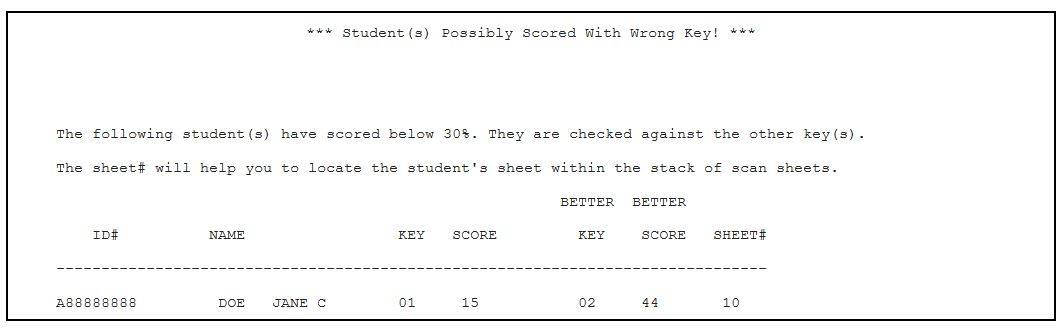
The preface page of the faculty exam output may also contain a list of students who have possibly been scored with the wrong key. This section prints only for exams that have multiple forms. In the example, the student scored below a 30% on an exam with two forms. The student’s raw score using key 1 was 15 and the student’s raw score using key 2 was 44. The sheet# indicates the location of the scan sheet. In this case, the faculty member needs to determine if the student’s exam was scored using the wrong key (TEMC will take no further action).
If there are no items to be flagged as possibly mis-keyed, and no students to be flagged as possibly scored with the wrong key, there will be no preface page, and your output will begin with your roster.
Rosters
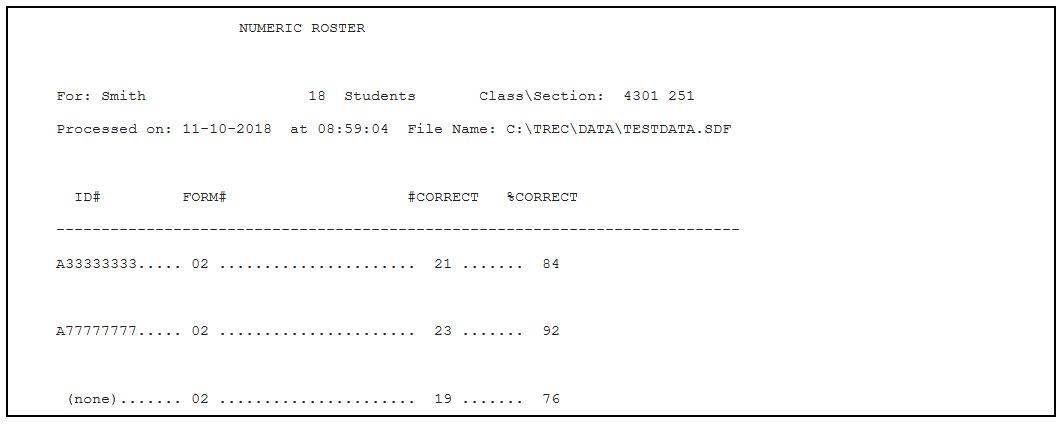
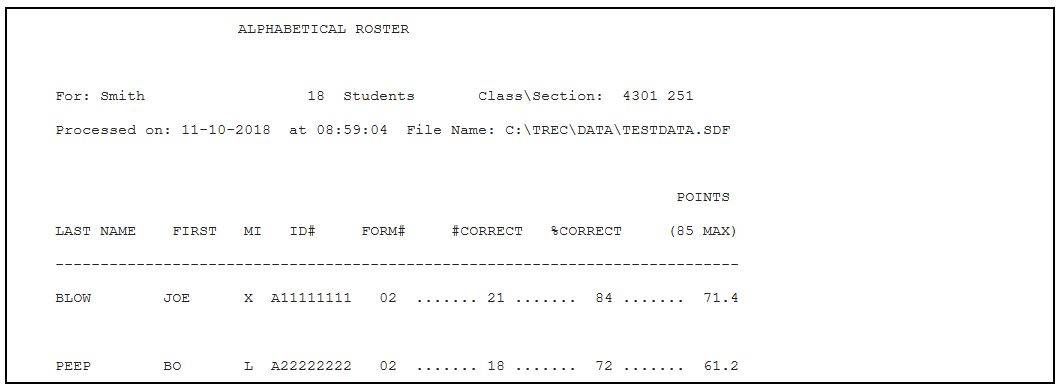
There are two roster types that may be selected for output: Alphabetical and Numeric. An Alphabetical roster lists students by last name, first name, middle initial, and student ID number, separated for each section submitted. Both roster types will also print a form number for each student. This is the form number of the key against which the student’s responses were scored. This is then followed by the raw number of questions answered correctly, and the percentage correct
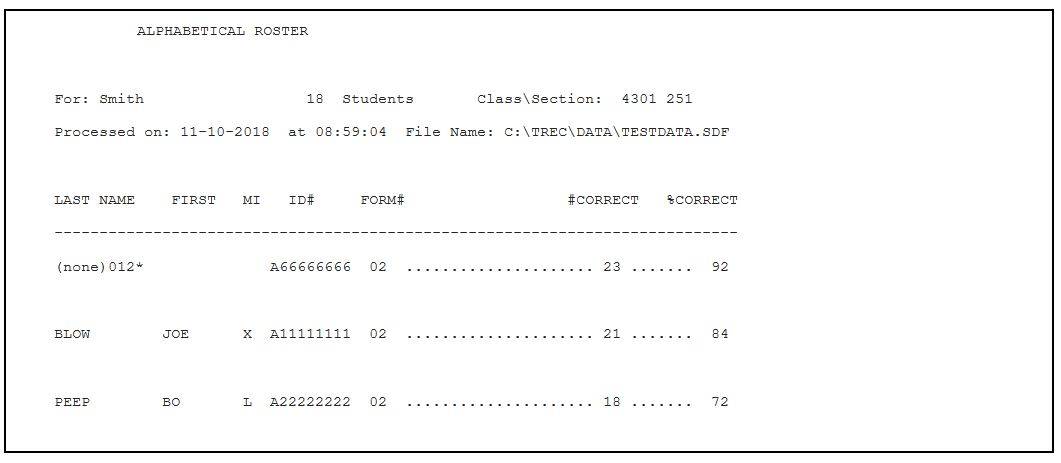
In the example above, the first line has no student name. This means the student did not bubble in his/her name on the answer sheet. The number 012 to the right of (none) indicates the location of the scan sheet in the stack. In this case, it is the 12th sheet from the top. In some cases (especially during finals) the exam might be scanned with the Opscan 8 (the second scanner). In this case the number 012 indicates that the exam is the 12th sheet from the bottom.
The Numeric roster omits all name data, and lists students by ID numbers only.
If your exam has a point maximum other than 100, an additional “points” column will be added to the roster. In the example below, the exam had 25 questions and was worth 85 points, so each question would be worth 3.4 points.
Another possible variation is for exams with weighted questions. If some questions on your exam are worth a different number of points than other questions, you will need to use the weighted option. In this case, the output file will provide raw number correct, points according to your assigned weights, and then a weighted percentage score:
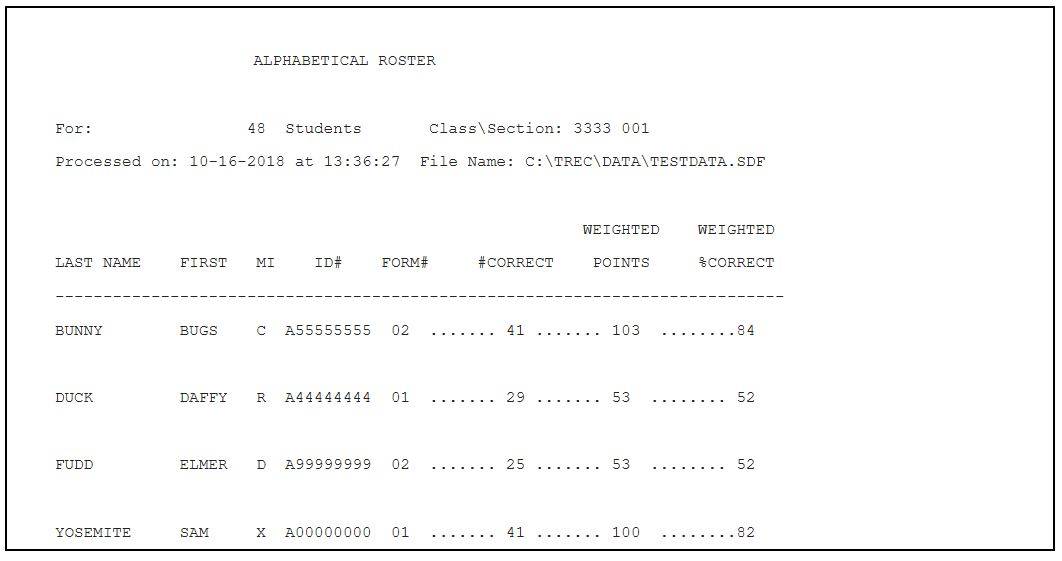
In the example above, there were 51 questions, with a maximum possible score of 122 points (31 questions worth 2 points each, and 20 questions worth 3 points each). Notice that the first and fourth students in the example above both got the same number of correct answers, but it has translated to different numbers of points because of the weighted scoring. Similarly, the second and third students got different numbers of questions correct, but achieved the same score. The final column (weighted percent) is calculated by dividing the weighted points by the maximum possible points.
Frequency Distributions
The frequency distribution shows both numerically and graphically the scores which the students received, and how many students received each score. In the example below, the first column shows the raw scores which the students received. The raw scores ranged from 13 to 23. The second column shows the equivalent percentage correct for each raw score. The third column, labeled Frequency shows how many students received each raw score. In the example, 1 student received a raw score of 13 and 5 students received a raw score of 20. The next column is a running total of the frequencies so the final line will show the total number of students in the distribution. The Percent column shows the percentage of students who earned each particular score. In the example, you can see 5 students answered 20 questions correctly. There are 18 students in the distribution. Therefore, 5/18 of the students or 27.8% had 20 correct. The next column is a running total of the percent column and must end with 100.0. The final column is a duplicate of the first column (raw score) and is used for reference. To the right of the last column is a graphical representation of the score distribution. Each dash represents one student. Frequency distributions can be generated one for each section, one for each form, or one for the entire run. Any one, or all three may be chosen.
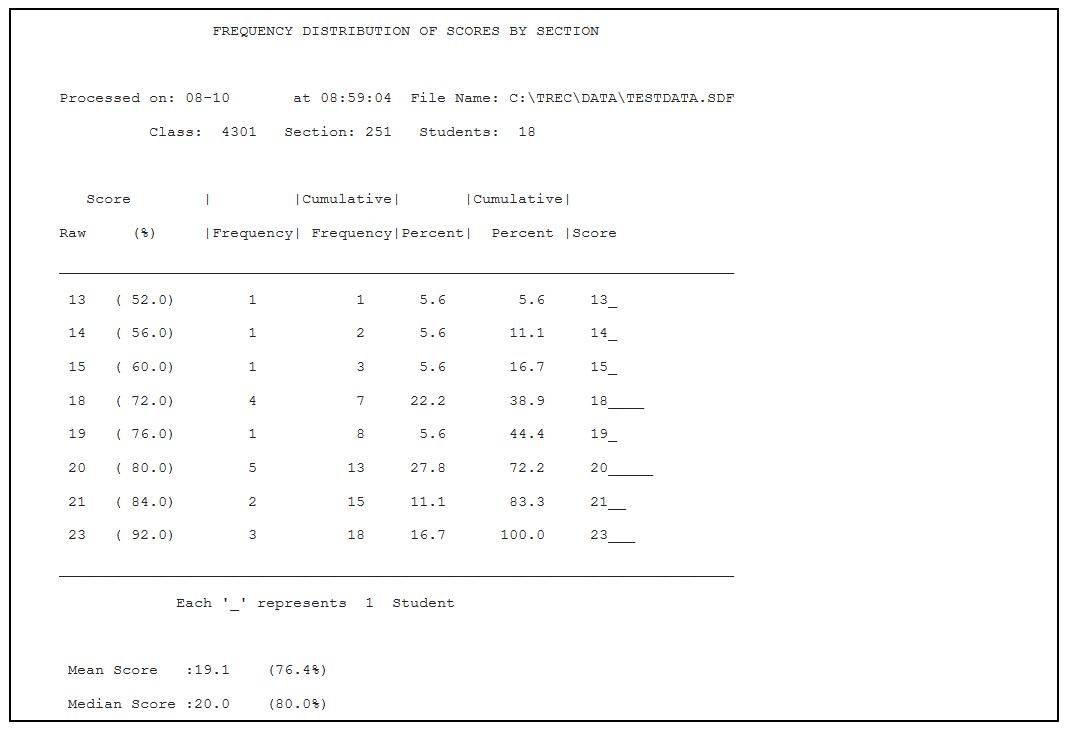
If weighted scores are used, the first and last columns will be Weighted Points rather than raw score, and the second column will be the weighted percentage.
Mean/Median
The mean is the most commonly used estimate of a typical score. It is the sum of all the scores (per distribution), divided by the number of students. The median is the score which splits the distribution in half so that half the students score above and half score below it. In the example above, the mean is 19.1 and the median falls at a score of 20. The mean and the median will be similar if the scores are symmetrically distributed. However, when there are some extreme scores, the median may be a better estimate of central tendency.
Item Analysis
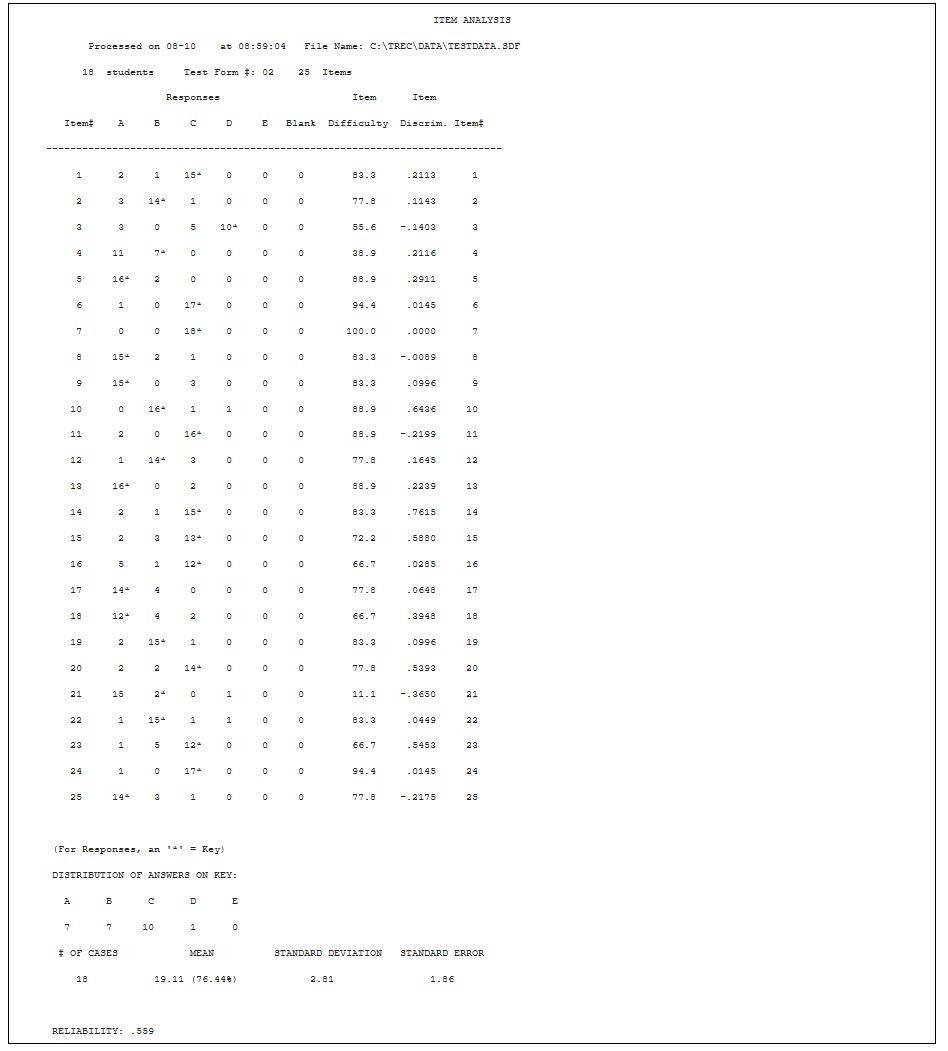
When scoring an exam, an Item Analysis will be generated for each unique key form used. In the example below, you can see that there were 25 items on key form #02. The first column of the Item Analysis lists the item numbers. The next 5 columns are titled A, B, C, D, & E. These refer to the 5 choices each question had (you can have up to 10 response choices, depending on the type of key and answer sheet used). For item 1, no student chose D or E, while 2 students chose A, 1 student chose B, and 15 students chose C. The asterisk indicates the correct answer; for item #1, C is the correct answer. If you choose multiple answers correct or credit for all, all correct responses will have asterisks. The next column indicates how many students left the item blank.
Item Difficulty
The item difficulty column shows the percentage of students who answered each item correctly. Everyone answered item 7 correctly, so the item difficulty for this item is 100.0.
Item Discrimination
The item discrimination is a correlation between the points awarded on an item and the total test score. When the item discrimination is positive, students who answered the item correctly performed better on the rest of the test than students who answered the item incorrectly. When the item discrimination is negative, students who answered the item incorrectly did better on the rest of the test than students who answered the item correctly. Item discriminations of 0 mean that there is no difference between the two groups. In the sample item analysis, item 7 has an item discrimination of 0. Everyone answered this item correctly, so there were not two groups to discriminate between (i.e., those who answered correctly vs. those who answered incorrectly). Item 8 shows that 15 students answered the item correctly and 3 answered the item incorrectly. The item discrimination is slightly negative for this item, which means that the 3 students who missed the item actually did better on the test than the 15 students who answered correctly. This can often be interpreted in three ways. The item is:
- dissimilar from the other items, not measuring or assessing what the other items are measuring or assessing;
- ambiguous or poorly worded; or
- mis-keyed (the wrong answer was bubbled on the answer key).
In the example above, item 21 was intentionally mis-keyed. As this item illustrates, there is a very low passing rate (i.e., low item difficulty) and negative item discrimination. If an item is determined to be poorly worded or ambiguous, it can be dropped from the exam by leaving the answer key blank for that item. If the faculty member decides this is the case, he/she can contact the Testing, Research-Support, and Evaluation Center at 5-2276 and request that the item be dropped. The center makes the requested changes and reruns the rosters.
Standard Deviation
The standard deviation is a measure of how far the scores deviate from the mean. The more spread out the scores the larger the standard deviation.
Standard Error
The concept of the standard error of measurement involves repeated testing of an individual with the test. Because of slight differences in testing conditions and individual responses, the scores on the test will likely not be the same. Instead there will be a distribution of scores, and the mean of the distribution is generally considered to be the best estimate of the person’s ability. The standard error of measurement is the standard deviation of this distribution. The value computed by the scoring program uses information from only one administration of a test. By assuming that the distribution of scores would be normally distributed, the standard error of measurement can be estimated. In the example, the SEM is 1.86. This may be interpreted to mean that the score which best represents a student’s true capability will be within 1.86 points of his or her raw score about 68% of the time, or within 3.72 points 95% of the time.
Reliability
This coefficient is an estimate of the extent to which each item measures what the entire test is measuring and can be thought of as an index of a test’s internal consistency. Reliability will have a value between 0.00 and 1.00. A reliability of 1.00 means that each item measures exactly the same ability as does the total test score, while a reliability of 0.00 means that the item scores are unrelated to the total test. Values between approximately .60 and .80 are typical for classroom tests.
Reliability is influenced by several test characteristics. Most important is similarity of the content of the items. A test which attempts to assess many different abilities will probably have lower reliability than a test which attempts to measure only one ability. Also of importance is the length of the test. In general, longer tests are more reliable than shorter tests. A third influence on reliability is difficulty. Tests which are very easy or very difficult tend to be less reliable than those of moderate difficulty.
The reliability of a test may be increased by using the information provided in the Item Analysis. The most important thing to look at is the Item Discrimination. A test’s reliability will be increased by deleting items with negative discriminations (even though the test will be shortened). However, when considering deleting any item from a test, remember that the item statistics should only serve as a guide and that small increases in reliability are less important than representative coverage of the topic area. This is particularly true when class size is below 30.
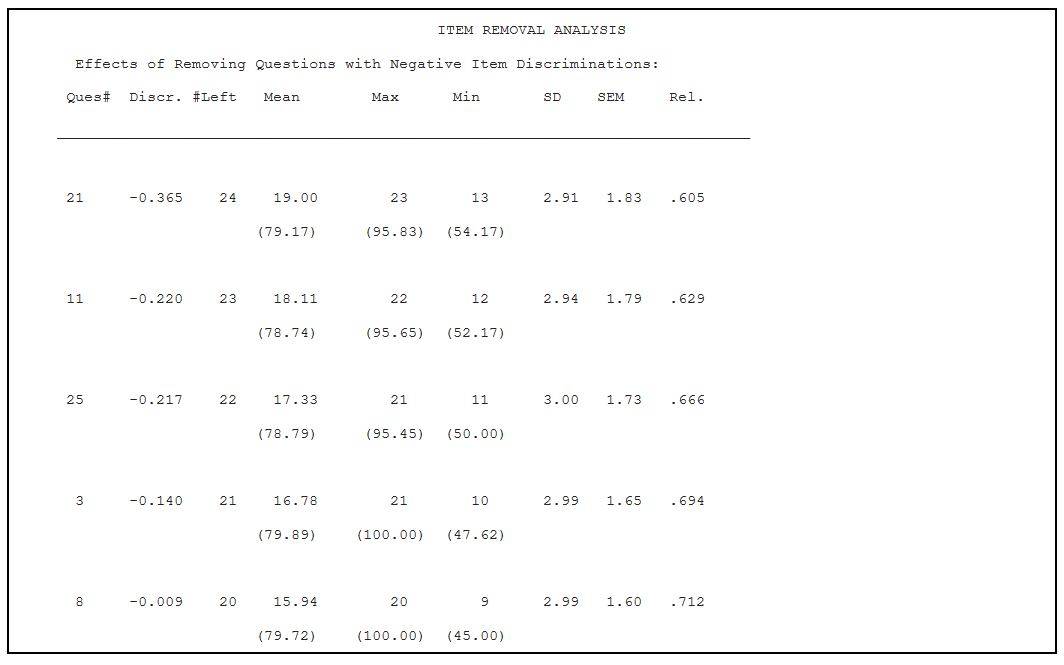
Item Removal Analysis
If there are any items with negative discriminations on a test, then an Item Removal Analysis will print at the end of the output. Statistics will be regenerated allowing you to see how dropping an item would affect the overall statistics (presuming all items with lower discriminations have also been removed). In the example, you can see that item 21 had a negative discrimination of -.365. If this item were dropped from the test, then the new mean score would be 19, the new maximum score would be 23, the new minimum score would be 13, the new standard deviation (SD) would be 2.91, the new standard error (SEM) would be 1.83, and the new reliability would be .605. As this example illustrates, dropping all items with negative discriminations would yield a reliability of .712. This output is included with your results but items are only dropped if you call TEMC to indicate that we should drop them.